Datavih’z
Made with Mathieu Barnola Dorine Szymanski and Amélie Richard, supervised by Clément Gault.
Third year of Bachelor in EDNA, Graphic Design - 2023
Datavisualisation, graphic design, mosaic printing
Credits : Photos by Dorine Szymanski and me.
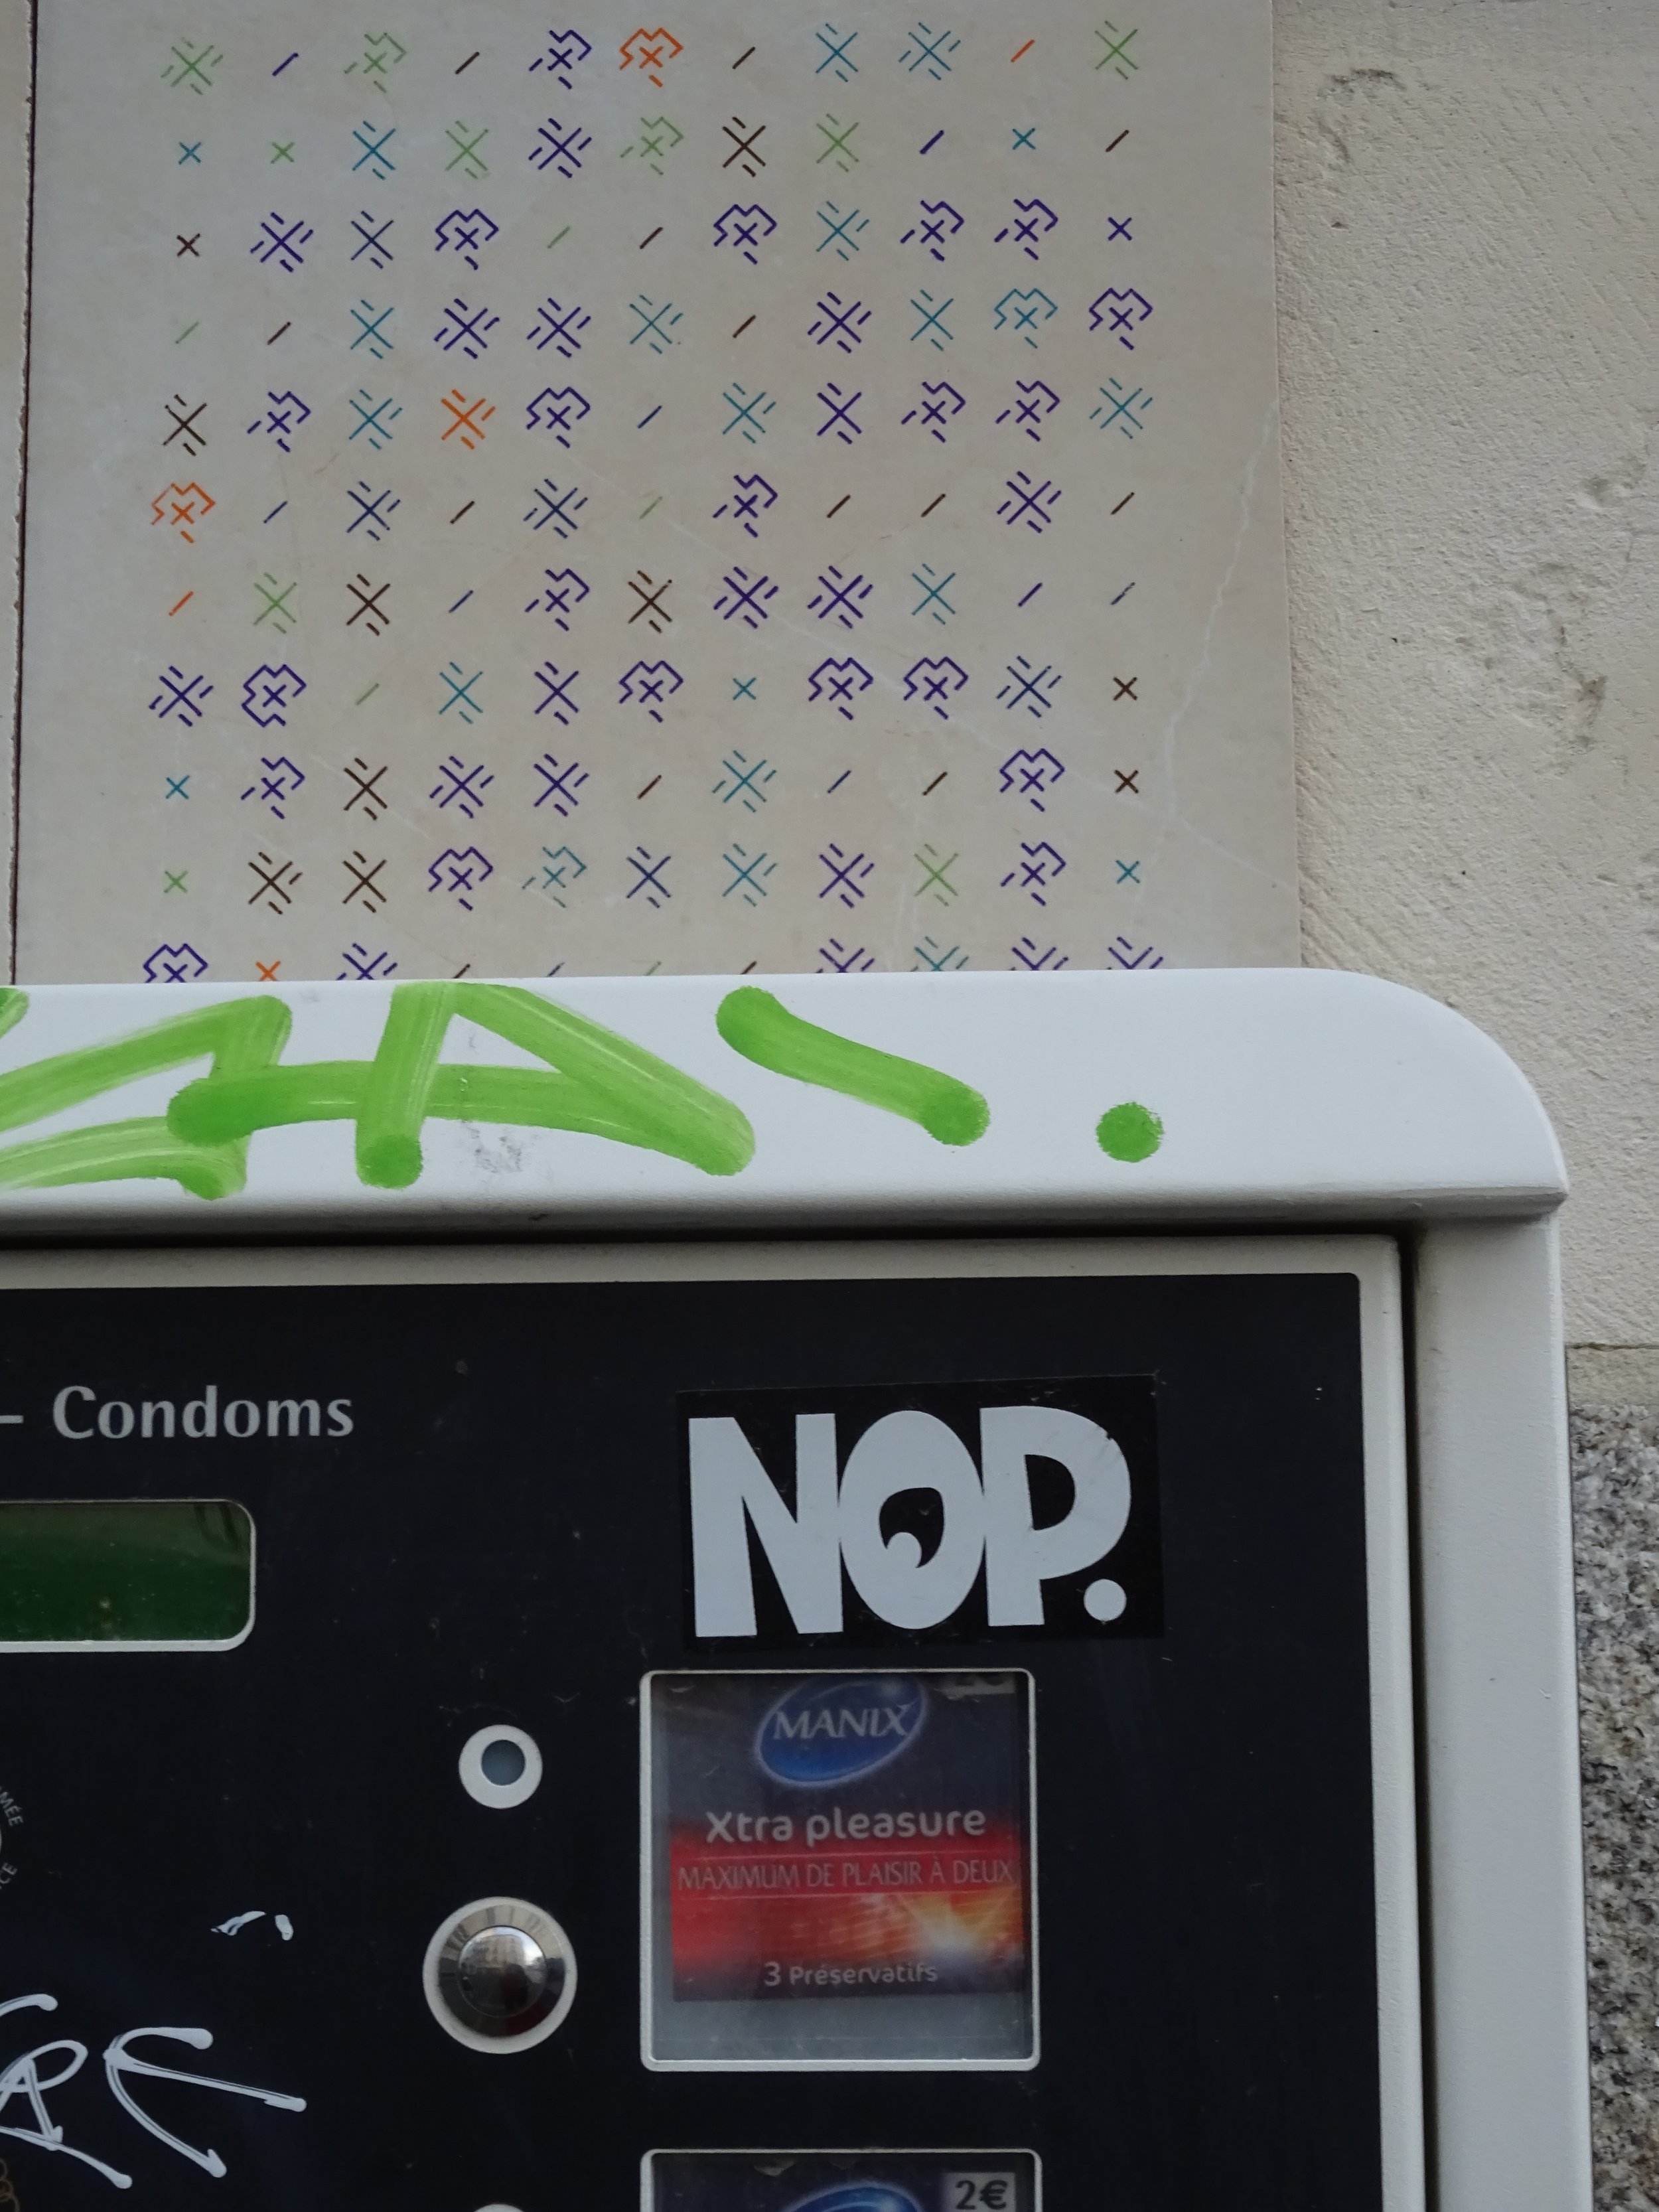
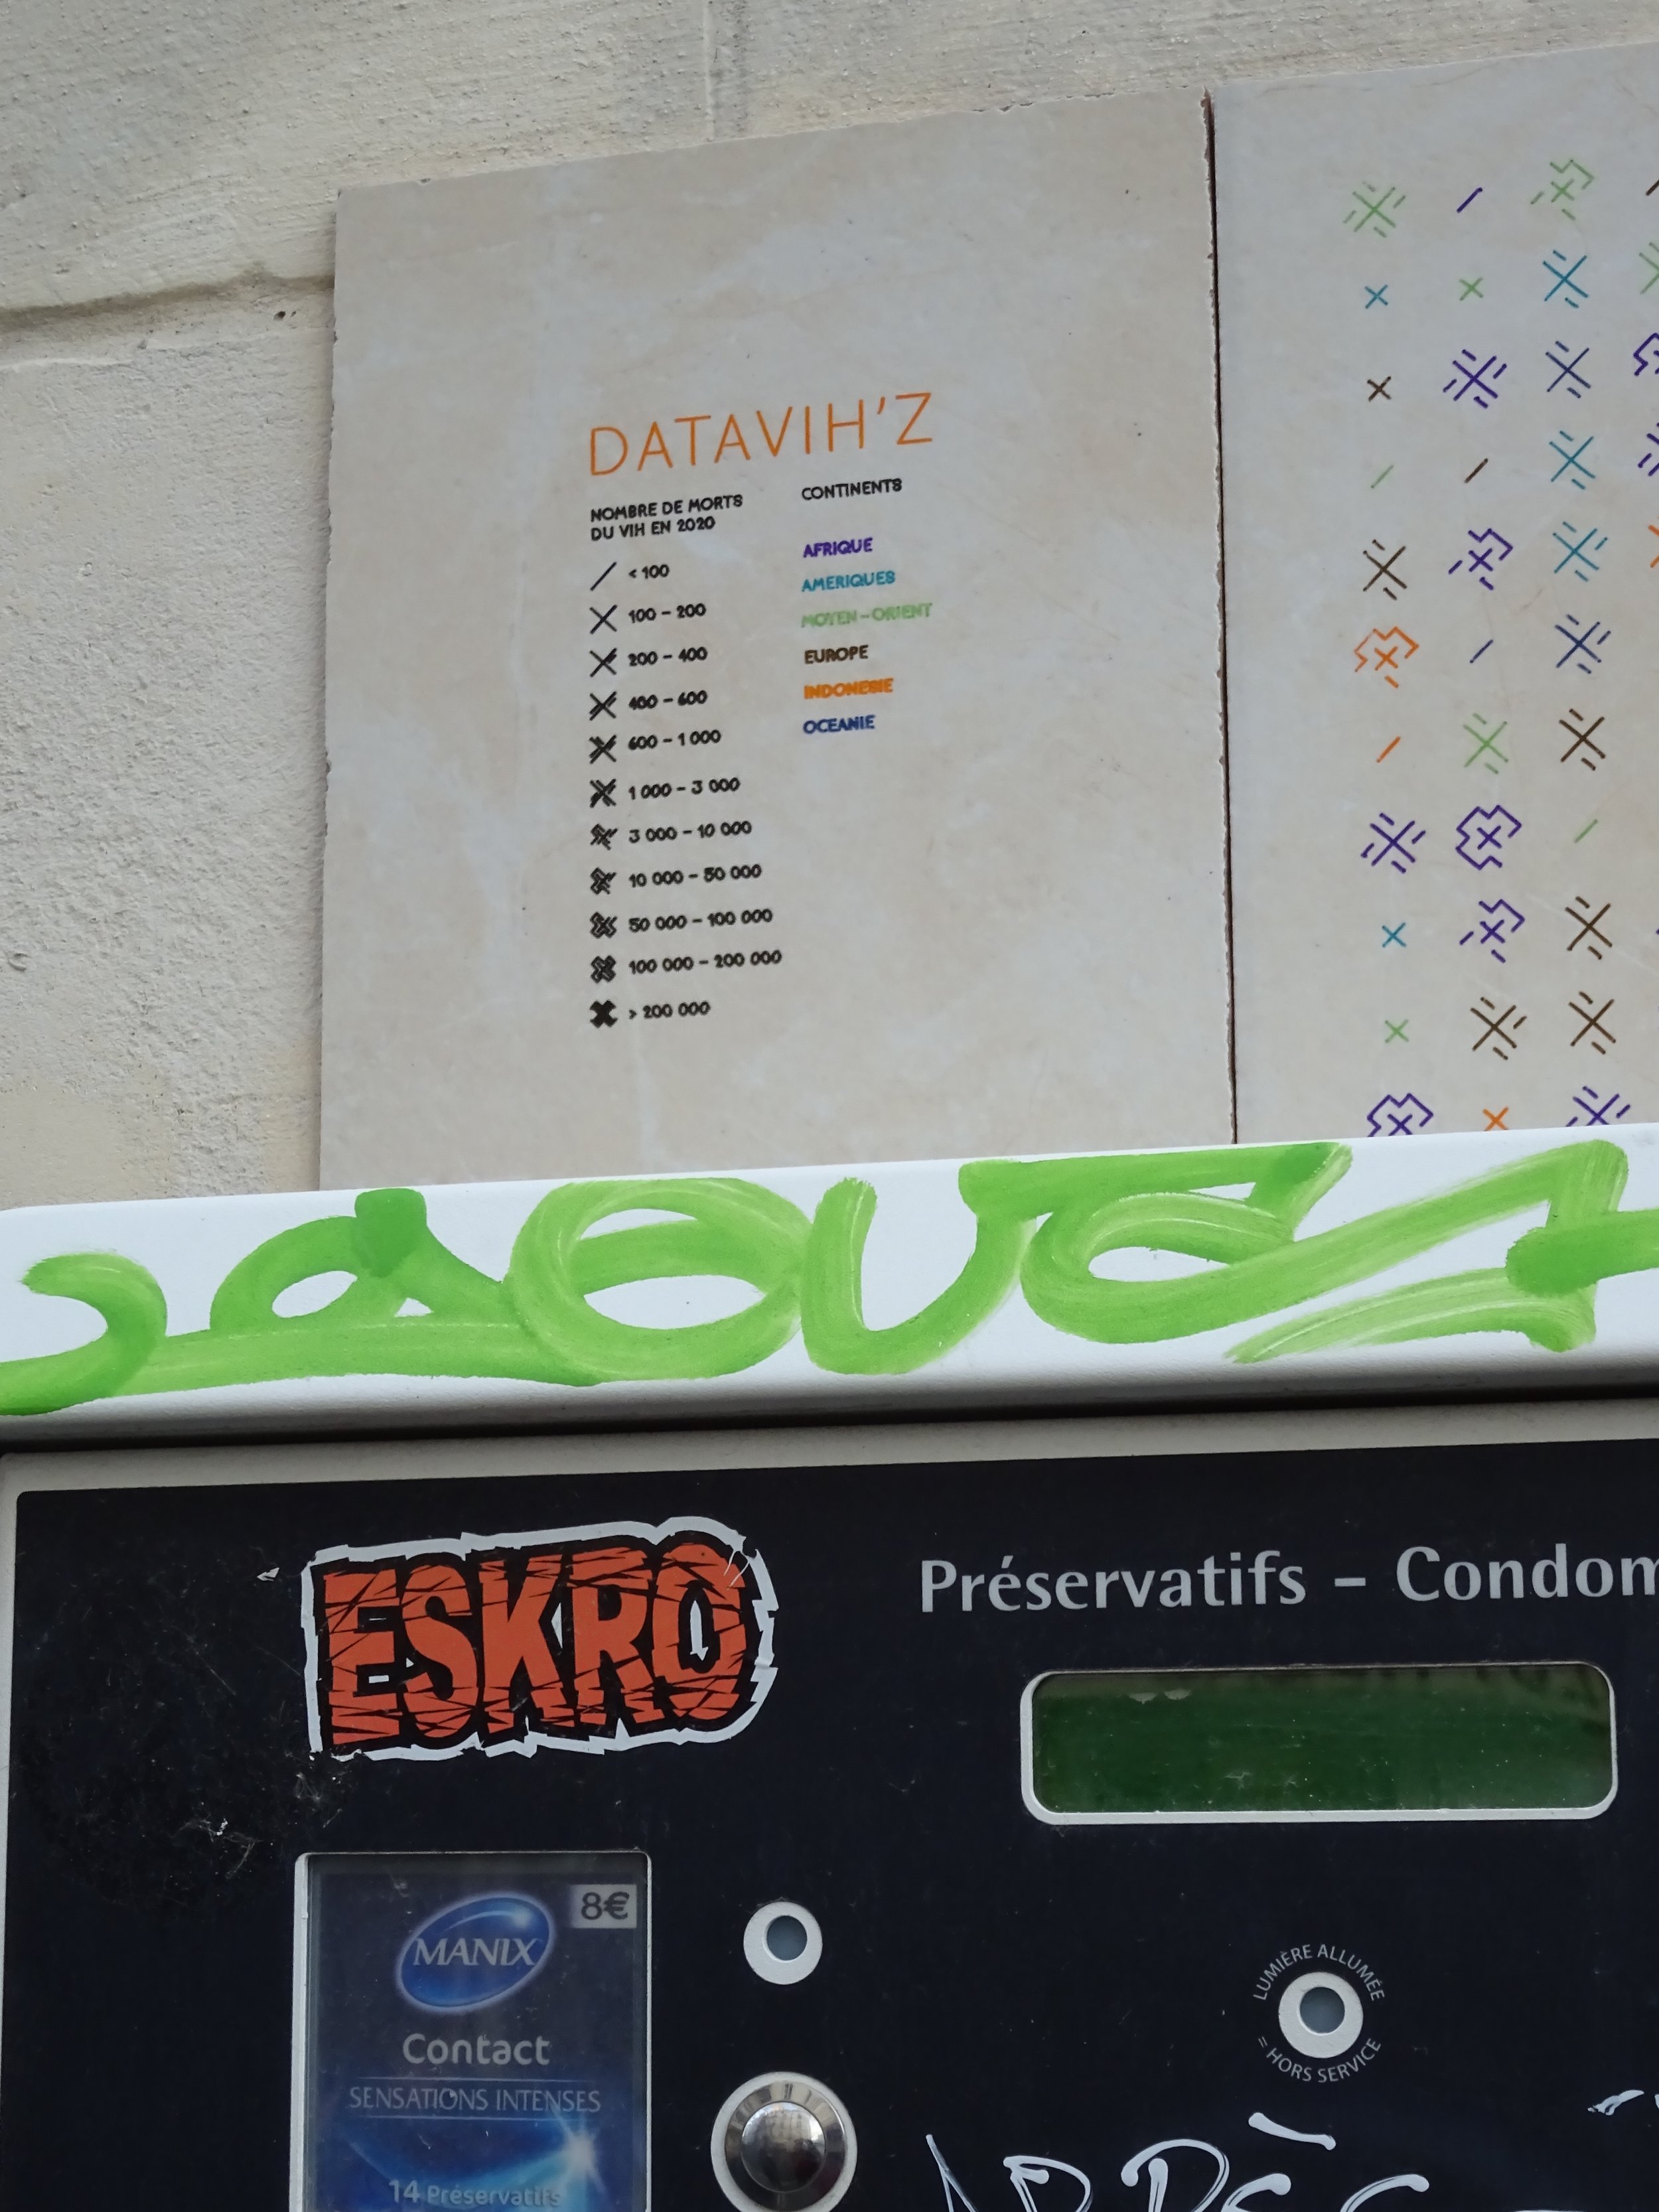
Together, we designed a datavisualisation representing the number of deaths due to the HIV around the world. We made differents signs, each one for the number of death, and the colors representing the differents countries and continents around the world. Then, we put it into a mosaic pannel.
To make this one as a prevention campagne, we decided to stick the pannel above a condom dispenser, next to a pharmacy in the center of Nantes, to convaince people to protect themselves. The meaning of this datavisualisation was to prevent people about the danger of HIV, and to show how impactful it can be.
Wanna take a look ? Go there ! ︎︎︎